Profiler
简介
DeepLink Profiler 是一个允许在训练和推理过程中收集性能指标的工具。Profiler的上下文管理器API可用于了解哪些模型算子最耗时,并检查其输入形状和堆栈跟踪,研究设备kernel活动并可视化执行跟踪。当使用DeepLink进行模型训练时,可以使用DeepLink Profiler定位性能瓶颈,指导性能优化。
使用说明
本教程将以resnet18模型为例,讲解如何使用DeepLink Profiler分析模型性能。
1. 导入必要的库
import torch_dipu
import torch
import torchvision.models as models
from torch.profiler import profile, record_function, ProfilerActivity
2. 实例化 resnet18 模型
model = models.resnet18()
inputs = torch.randn(5, 3, 224, 224)
3. 使用 DeepLink profiler 分析模型执行时间
DeepLink profiler 接口对齐了PyTorch Profiler,通过上下文管理器启用,并接受很多参数,常用的参数有
activities:要收集的打点列表ProfilerActivity.CPU:收集PyTorch算子、TorchScript函数以及用户自定义代码标签ProfilerActivity.CUDA:收集设备kernel打点
record_shapes:是否记录算子输入的形状profile_memory:是否统计模型张量内存消耗use_cuda:是否统计设备 kernel 执行时间with_stack:是否打印调用栈
with profile(activities=[ProfilerActivity.CPU], record_shapes=True) as prof:
    with record_function("model_inference"):
        model(inputs)
打印出上面执行的统计数据:
print(prof.key_averages().table(sort_by="cpu_time_total", row_limit=10))
输出如下:
---------------------------------  ------------  ------------  ------------  ------------  ------------  ------------
                             Name    Self CPU %      Self CPU   CPU total %     CPU total  CPU time avg    # of Calls
---------------------------------  ------------  ------------  ------------  ------------  ------------  ------------
                  model_inference         6.44%      16.339ms       100.00%     253.751ms     253.751ms             1
                     aten::conv2d         0.07%     184.000us        87.19%     221.245ms      11.062ms            20
                aten::convolution         0.18%     460.000us        87.12%     221.061ms      11.053ms            20
               aten::_convolution         0.12%     298.000us        86.94%     220.601ms      11.030ms            20
                aten::thnn_conv2d         0.05%     128.000us        86.82%     220.303ms      11.015ms            20
       aten::_slow_conv2d_forward        86.61%     219.779ms        86.77%     220.175ms      11.009ms            20
                 aten::batch_norm         0.06%     155.000us         3.56%       9.036ms     451.800us            20
     aten::_batch_norm_impl_index         0.12%     313.000us         3.50%       8.881ms     444.050us            20
          aten::native_batch_norm         3.20%       8.126ms         3.36%       8.531ms     426.550us            20
                 aten::max_pool2d         0.03%      72.000us         1.24%       3.136ms       3.136ms             1
---------------------------------  ------------  ------------  ------------  ------------  ------------  ------------
Self CPU time total: 253.751ms
从输出中可以发现,大部分的执行时间花在conv2d。
需要说明的是,cpu time是指这个算子执行的总时间;同时,该算子有可能调用其他算子,self cpu time是该算子的总时间减去调用其他算子的时间。
要获得更精细的结果粒度并包括运算符输入形状,需要设置group_by_input_shape=True(注意:这需要将 profiler 的输入参数record_shape设置为 True)
print(prof.key_averages(group_by_input_shape=True).table(sort_by="cpu_time_total", row_limit=10))
输出如下
---------------------------------  ------------  ------------  ------------  ------------  ------------  ------------  --------------------------------------------------------------------------------
                             Name    Self CPU %      Self CPU   CPU total %     CPU total  CPU time avg    # of Calls                                                                      Input Shapes
---------------------------------  ------------  ------------  ------------  ------------  ------------  ------------  --------------------------------------------------------------------------------
                  model_inference         6.22%      14.932ms       100.00%     239.937ms     239.937ms             1                                                                                []
                     aten::conv2d         0.01%      35.000us        35.20%      84.457ms      21.114ms             4                             [[5, 64, 56, 56], [64, 64, 3, 3], [], [], [], [], []]
                aten::convolution         0.04%     105.000us        35.19%      84.422ms      21.105ms             4                     [[5, 64, 56, 56], [64, 64, 3, 3], [], [], [], [], [], [], []]
               aten::_convolution         0.03%      64.000us        35.14%      84.317ms      21.079ms             4     [[5, 64, 56, 56], [64, 64, 3, 3], [], [], [], [], [], [], [], [], [], [], []]
                aten::thnn_conv2d         0.01%      27.000us        35.11%      84.253ms      21.063ms             4                                 [[5, 64, 56, 56], [64, 64, 3, 3], [], [], [], []]
       aten::_slow_conv2d_forward        35.05%      84.101ms        35.10%      84.226ms      21.056ms             4                                 [[5, 64, 56, 56], [64, 64, 3, 3], [], [], [], []]
                     aten::conv2d         0.01%      34.000us        14.44%      34.645ms      34.645ms             1                             [[5, 3, 224, 224], [64, 3, 7, 7], [], [], [], [], []]
                aten::convolution         0.03%      82.000us        14.43%      34.611ms      34.611ms             1                     [[5, 3, 224, 224], [64, 3, 7, 7], [], [], [], [], [], [], []]
               aten::_convolution         0.03%      64.000us        14.39%      34.529ms      34.529ms             1     [[5, 3, 224, 224], [64, 3, 7, 7], [], [], [], [], [], [], [], [], [], [], []]
                aten::thnn_conv2d         0.01%      15.000us        14.36%      34.465ms      34.465ms             1                                 [[5, 3, 224, 224], [64, 3, 7, 7], [], [], [], []]
---------------------------------  ------------  ------------  ------------  ------------  ------------  ------------  --------------------------------------------------------------------------------
从输出可以看到,resnet18 模型中卷积包含了几种不同的形状。
Profiler 还可用于分析在 GPU 和其他 AI 加速芯片上执行的模型的性能:
model = models.resnet18().cuda()
inputs = torch.randn(5, 3, 224, 224).cuda()

with profile(activities=[
        ProfilerActivity.CPU, ProfilerActivity.CUDA], record_shapes=True) as prof:
    with record_function("model_inference"):
        model(inputs)

print(prof.key_averages().table(sort_by="cuda_time_total", row_limit=20))
输出如下:
-------------------------------------------------  ------------  ------------  ------------  ------------  ------------  ------------  ------------  ------------  ------------  ------------
                                             Name    Self CPU %      Self CPU   CPU total %     CPU total  CPU time avg     Self CUDA   Self CUDA %    CUDA total  CUDA time avg    # of Calls
-------------------------------------------------  ------------  ------------  ------------  ------------  ------------  ------------  ------------  ------------  ------------  ------------
                                  model_inference         3.29%       4.726ms       100.00%     143.583ms     143.583ms       0.000us         0.00%     168.781ms     168.781ms             1
                                 aten::batch_norm         0.11%     155.000us        39.21%      56.305ms       2.815ms       0.000us         0.00%      71.949ms       3.597ms            20
                     aten::_batch_norm_impl_index         0.20%     284.000us        39.11%      56.150ms       2.808ms       0.000us         0.00%      71.949ms       3.597ms            20
                          aten::native_batch_norm         0.35%     501.000us        35.33%      50.734ms       2.537ms      48.501ms        28.74%      69.400ms       3.470ms            20
                                     aten::conv2d         0.11%     155.000us        34.03%      48.859ms       2.443ms       0.000us         0.00%      63.652ms       3.183ms            20
                                aten::convolution         0.27%     383.000us        33.92%      48.704ms       2.435ms       0.000us         0.00%      63.652ms       3.183ms            20
                               aten::_convolution         0.16%     223.000us        33.65%      48.321ms       2.416ms       0.000us         0.00%      63.652ms       3.183ms            20
                   aten::convolution_overrideable         0.16%     230.000us        33.50%      48.098ms       2.405ms      45.552ms        26.99%      63.652ms       3.183ms            20
                           dipu_native_batch_norm         0.00%       0.000us         0.00%       0.000us       0.000us      48.501ms        28.74%      48.501ms       2.425ms            20
                    dipu_convolution_overrideable         0.00%       0.000us         0.00%       0.000us       0.000us      45.552ms        26.99%      45.552ms       2.278ms            20
                               diopiConvolution2d         0.00%       0.000us         0.00%       0.000us       0.000us      38.100ms        22.57%      38.100ms       1.905ms            20
                                   diopiBatchNorm         0.00%       0.000us         0.00%       0.000us       0.000us      31.526ms        18.68%      31.526ms       1.576ms            20
                                      aten::empty         1.52%       2.177ms        39.24%      56.337ms     249.279us      29.275ms        17.34%      29.275ms     129.535us           226
                 wrapper_DIPU_empty_memory_format         0.00%       0.000us         0.00%       0.000us       0.000us      29.257ms        17.33%      29.257ms     129.456us           226
                                       aten::add_         0.32%     458.000us        16.32%      23.433ms     836.893us      19.821ms        11.74%      25.136ms     897.714us            28
              LaunchKernel_dipu_native_batch_norm         2.07%       2.965ms        34.99%      50.233ms       2.512ms       0.000us         0.00%      20.899ms       1.045ms            20
                                 dipu_add__tensor         0.00%       0.000us         0.00%       0.000us       0.000us      19.821ms        11.74%      19.821ms     707.893us            28
                              aten::empty_strided         0.93%       1.341ms        24.80%      35.605ms     256.151us      18.928ms        11.21%      18.928ms     136.173us           139
                       wrapper_DIPU_empty_strided         0.00%       0.000us         0.00%       0.000us       0.000us      18.928ms        11.21%      18.928ms     136.173us           139
       LaunchKernel_dipu_convolution_overrideable         2.36%       3.384ms        33.34%      47.868ms       2.393ms       0.000us         0.00%      18.100ms     905.000us            20
-------------------------------------------------  ------------  ------------  ------------  ------------  ------------  ------------  ------------  ------------  ------------  ------------
Self CPU time total: 143.583ms
Self CUDA time total: 168.781ms
从输出可以看到,diopiConvolution2d和diopiBatchNorm是两个算子耗时最长。
4. 分析内存消耗
PyTorch profiler 还可以统计算子分配或释放的内存量。要启用内存分析功能,请将 profile_memory 设置成 True。
model = models.resnet18()
inputs = torch.randn(5, 3, 224, 224)
with profile(activities=[ProfilerActivity.CPU], profile_memory=True, record_shapes=True) as prof:
    model(inputs)

print(prof.key_averages().table(sort_by="cpu_memory_usage", row_limit=10))
输出如下:
---------------------------------  ------------  ------------  ------------  ------------  ------------  ------------  ------------  ------------
                             Name    Self CPU %      Self CPU   CPU total %     CPU total  CPU time avg       CPU Mem  Self CPU Mem    # of Calls
---------------------------------  ------------  ------------  ------------  ------------  ------------  ------------  ------------  ------------
                      aten::empty         0.47%     557.000us         0.47%     557.000us       2.785us      94.85 Mb      94.85 Mb           200
                 aten::batch_norm         0.11%     126.000us        18.82%      22.476ms       1.124ms      47.41 Mb           0 b            20
     aten::_batch_norm_impl_index         0.36%     429.000us        18.71%      22.350ms       1.117ms      47.41 Mb           0 b            20
          aten::native_batch_norm        17.98%      21.480ms        18.33%      21.892ms       1.095ms      47.41 Mb     -71.00 Kb            20
                     aten::conv2d         0.18%     215.000us        70.73%      84.483ms       4.224ms      47.37 Mb           0 b            20
                aten::convolution         0.47%     558.000us        70.55%      84.268ms       4.213ms      47.37 Mb           0 b            20
               aten::_convolution         0.27%     325.000us        70.08%      83.710ms       4.186ms      47.37 Mb           0 b            20
         aten::mkldnn_convolution        69.02%      82.443ms        69.81%      83.385ms       4.169ms      47.37 Mb           0 b            20
                 aten::empty_like         0.08%     100.000us         0.15%     178.000us       8.900us      47.37 Mb           0 b            20
                 aten::max_pool2d         0.07%      80.000us         4.41%       5.268ms       5.268ms      11.48 Mb           0 b             1
---------------------------------  ------------  ------------  ------------  ------------  ------------  ------------  ------------  ------------
Self CPU time total: 119.442ms
5. 使用 Chrome trace viewer 进行可视化
Profiling 结果可以输出成 json 文件
model = models.resnet18().cuda()
inputs = torch.randn(5, 3, 224, 224).cuda()
with profile(activities=[ProfilerActivity.CPU, ProfilerActivity.CUDA]) as prof:
    model(inputs)

prof.export_chrome_trace("trace.json")
使用 Chrome trace viewer (chrome://tracing)工具查看 trace.json 文件,可视化结果如下图

6. 打印调用链
Profiler可用于分析Python和TorchScript堆栈跟踪。
with profile(
    activities=[ProfilerActivity.CPU, ProfilerActivity.CUDA],
    with_stack=True,
    experimental_config=torch._C._profiler._ExperimentalConfig(verbose=True)
) as prof:
    model(inputs)

print(prof.key_averages(group_by_stack_n=5).table(sort_by="self_cuda_time_total", row_limit=2))
输出如下:
-------------------------------------------------  ------------  ------------  ------------  ------------  ------------  ------------  ------------  ------------  ------------  ------------  -----------------------------------------------------------------
                                             Name    Self CPU %      Self CPU   CPU total %     CPU total  CPU time avg     Self CUDA   Self CUDA %    CUDA total  CUDA time avg    # of Calls  Source Location
-------------------------------------------------  ------------  ------------  ------------  ------------  ------------  ------------  ------------  ------------  ------------  ------------  -----------------------------------------------------------------
                   aten::convolution_overrideable         0.03%      37.000us         3.05%       4.253ms       4.253ms       4.044ms         2.38%       5.313ms       5.313ms             1  <built-in method conv2d of type object at 0x7f1c8db7ef20>
                                                                                                                                                                                               torch/nn/modules/conv.py(454): _conv_forward
                                                                                                                                                                                               torch/nn/modules/conv.py(462): forward
                                                                                                                                                                                               nn.Module: Conv2d_0
                                                                                                                                                                                               torchvision/models/resnet.py(266): _forward_impl

                    dipu_convolution_overrideable         0.00%       0.000us         0.00%       0.000us       0.000us       4.044ms         2.38%       4.044ms       4.044ms             1  <built-in method conv2d of type object at 0x7f1c8db7ef20>
                                                                                                                                                                                               torch/nn/modules/conv.py(454): _conv_forward
                                                                                                                                                                                               torch/nn/modules/conv.py(462): forward
                                                                                                                                                                                               nn.Module: Conv2d_0
                                                                                                                                                                                               torchvision/models/resnet.py(266): _forward_impl

-------------------------------------------------  ------------  ------------  ------------  ------------  ------------  ------------  ------------  ------------  ------------  ------------  -----------------------------------------------------------------
Self CPU time total: 139.666ms
Self CUDA time total: 169.640ms
7. 使用Profiler分析长时间运行任务
Profiler 提供了一个额外的 API 来处理长时间运行的作业(如模型训练)。跟踪所有的执行可能很慢,并导致非常大的跟踪文件。要避免这种情况,请使用可选参数:
schedule:指定一个函数,该函数以整数参数作为输入,并返回一个动作给 Profiler。使用这个参数的最佳方式是使用torch.profiler.schedule辅助函数,它可以为您生成一个 scheduleon_trace_ready:指定一个函数,该函数将 Profiler 的引用作为输入,并在每次准备好新跟踪时由 Profiler 调用。
为了说明 API 是如何工作的,让我们首先考虑以下带有torch.profiler.schedule函数的示例:
from torch.profiler import schedule

my_schedule = schedule(
    skip_first=10,
    wait=5,
    warmup=1,
    active=3,
    repeat=2)
Profiler 假设长时间运行的任务由多个步骤组成,步骤编号从零开始。上面的示例定义了分析器的以下操作序列:
参数
skip_first告诉分析器在前 10 个步骤中忽略追踪(skip_first的默认值为零);在前
skip_first个步骤之后,分析器开始执行分析器周期;每个周期包括三个阶段:
空闲阶段(
wait=5步骤),在此阶段分析器处于非活动状态;预热阶段(
warmup=1步骤),在此阶段分析器开始追踪,但结果会被丢弃。此阶段用于丢弃追踪开始时分析器获取的样本,因为它们通常会被额外的开销所影响;活动追踪阶段(
active=3步骤),在此阶段分析器进行追踪和记录数据;
可选的 repeat 参数指定循环的上限。默认情况下(零值),分析器将在任务运行时执行循环。
因此,在上面的示例中,分析器将跳过前 15 个步骤,将下一个步骤用于预热,积极记录接下来的 3 个步骤,再跳过另外 5 个步骤,将下一个步骤用于预热,再积极记录另外 3 个步骤。由于指定了 repeat=2 参数值,分析器将在第一个两个周期后停止记录。
在每个周期结束时,分析器调用指定的 on_trace_ready 函数,并将自身作为参数传递。该函数用于处理新的追踪结果,可以通过获取表格输出或将输出保存为追踪文件来进行处理。
要向分析器发送下一个步骤已开始的信号,请调用 prof.step() 函数。当前分析器步骤存储在 prof.step_num 中。
以下示例显示了如何使用上述概念:
def trace_handler(p):
    output = p.key_averages().table(sort_by="self_cuda_time_total", row_limit=10)
    print(output)
    p.export_chrome_trace("/tmp/trace_" + str(p.step_num) + ".json")

with profile(
    activities=[ProfilerActivity.CPU, ProfilerActivity.CUDA],
    schedule=torch.profiler.schedule(
        wait=1,
        warmup=1,
        active=2),
    on_trace_ready=trace_handler
) as p:
    for idx in range(8):
        model(inputs)
        p.step()
使用案例
案例一 Mobilenet v2 多卡训练性能分析与优化
1. 问题描述:
开发人员使用某个版本的DeepLink完成Mobilenet v2的适配后,发现该模型在NV上单机八卡训练很慢,需要进行性能优化,提升训练性能。
2. 使用 DeepLink Profiler 进行性能分析
修改
mmpretrain的tools/train.py,在runner.train()之前开启 Profiler,将收集到的性能分析数据存入mobilenetv2_profiler-slow
from mmengine.hooks import ProfilerHook

profiler_hook = ProfilerHook(by_epoch = False, profile_times=10, activity_with_cpu=True, activity_with_cuda=True, json_trace_path='mobilenetv2_profiler-slow')
runner.register_custom_hooks([profiler_hook])
使用 chrome trace viewer 查看,发现 conv2d 耗时长,从图中可以看到 conv2d 调用到了
thnn_conv2d,而不是预期的cudnn_convolution
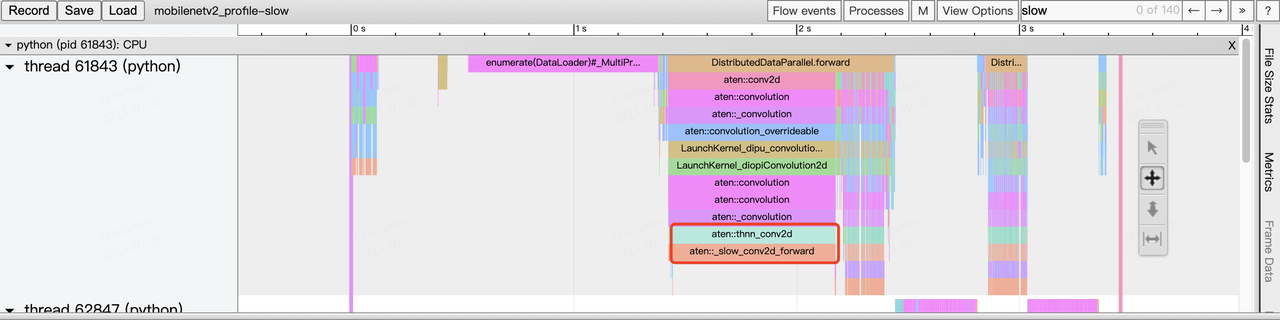
最后定位到DeepLink某个版本新增了
torch._C._set_cudnn_enabled(false),关闭了 cudnn,把这句话删除速度恢复正常。